In financial Astrology, there are a lot of strategies you can use to make your stock trades. One technique is using the Moon cycles. It’s well known that the moon influences our emotions.
High tides and low tides are caused by the Moon. Called tidal force. In #astrology the #moon rules our emotions. It might be fair to say during certain lunar events, it could trigger buying or selling emotions in #stock #Trading as the moon does deal with hope and fear. Thoughts?
— JASON ALEXANDER THE BLUE MOON OF NEPTUNE (@MarketMoonLord) January 17, 2021
MOON CYCLES FOR STOCK TRADING EXAMPLE $SINT
Now we are going to a specific example of how to use the Moon as a Stock Trading method.
To use this strategy, one must check the stock’s IPOed date. If the stock IPO date falls on Full Moon or New Moon on the First Trade Date then this stock is potentially a good stock to use for a Moon cycle stock trading strategy.
I have found a stock that IPOed a Day before a Full Moon. Ideally, you want it to fall on the exact day but Full Moons take effect 2-3 days before and after. Today will be looking at stock $SINT Sint Technologies. I did a video about the company and this company’s Natal Chart (NOT THE IPO CHART) if you want to learn about the company see the video.
What we are going to do next is analyze the last 8 Full Moons trading days on Sint Technologies (Ticker $Sint) and look for any patterns we can use for buying in selling points. Also, keep in mind we want us to this technique in conjunction with technical chart analysis specifically the oversold or overbought conditions using the RSI indicators.
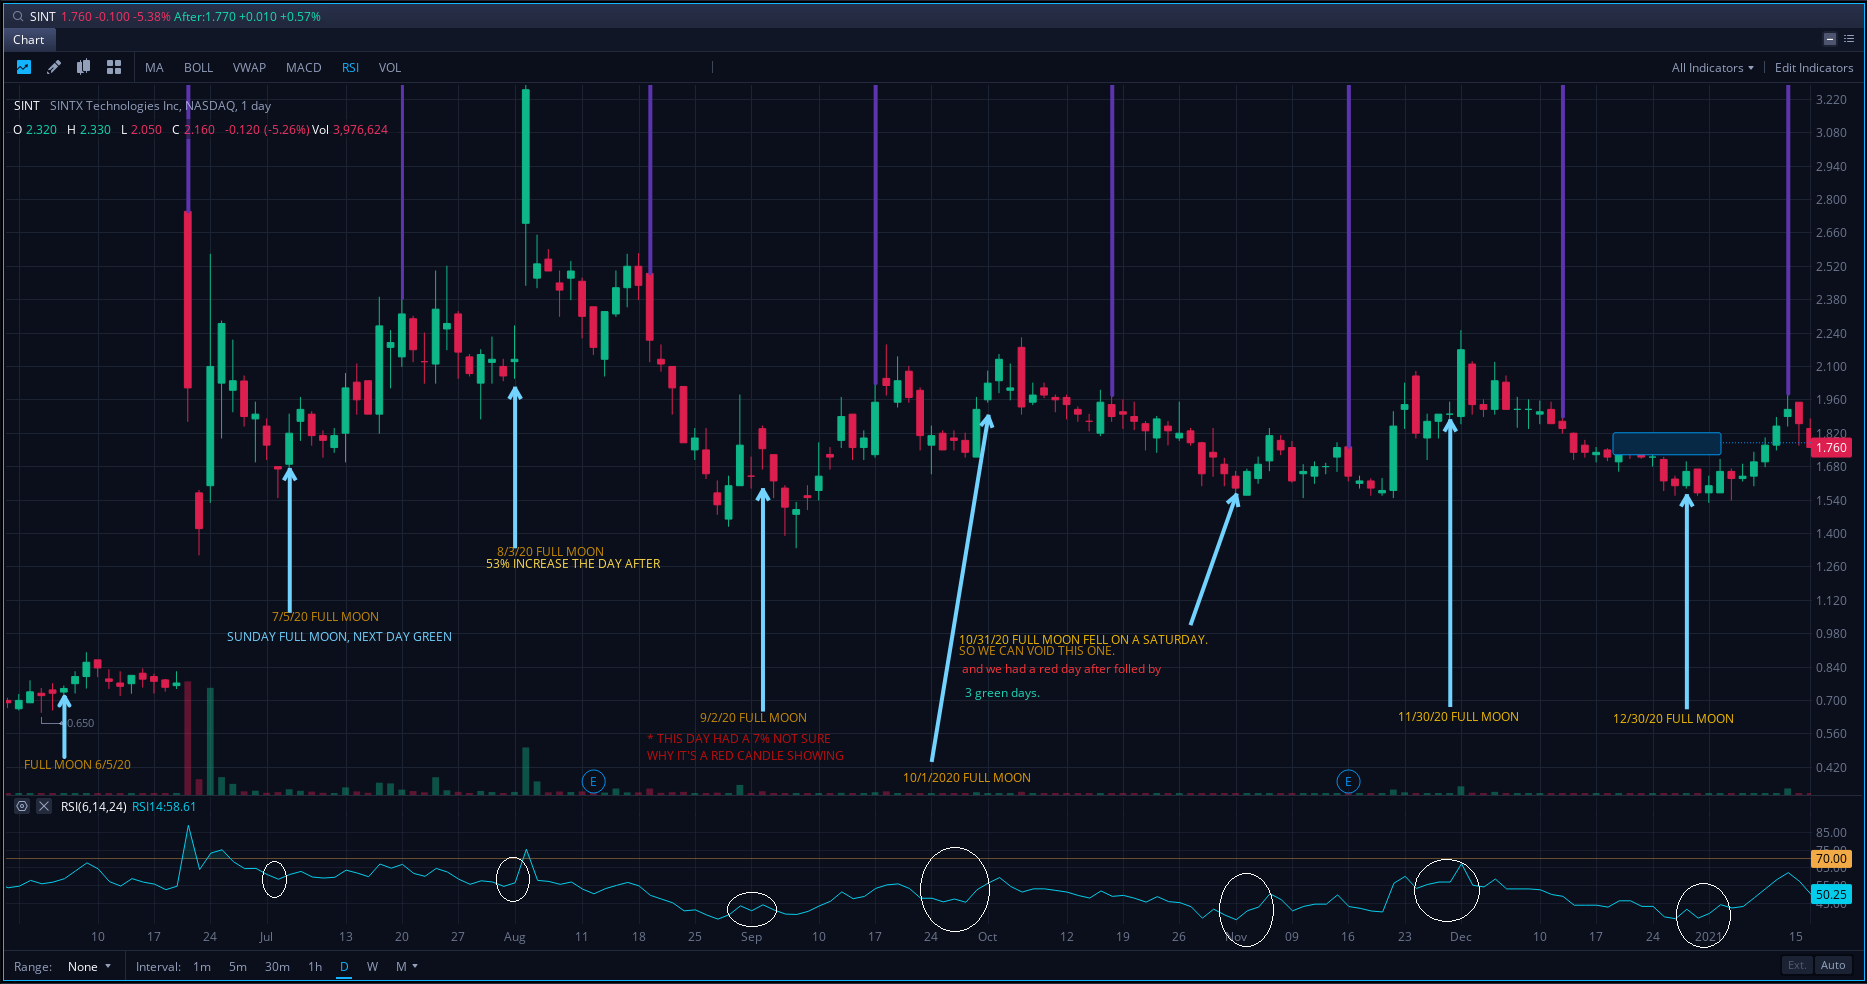
Here are the Last 8 Full Moon of 2020 on Top of $Sint’s Chart.
| 6/5/20 | 7/5/20 | 8/3/20 | 9/2/20 | 10/1/20 | 10/31/20 | 11/30/20 | 12/30/20 |
|---|
FULL MOON CHART ANALYSIS FOR #SINT RESULTS
As you can see on each of the last Full Moons in 2020 we had a price jump on the full Moon or 2 days around it. Most of them had 2 or 3-day bull run. The Full triggers a median range of 20% bull runs! I think that is pretty interesting. For more details watch the video below and let me know what you think in the comments!


[…] to make your stock trades. Today I will be making a prediction on $SINT Sint Technologies using the Moon Phase Stock Trading technique. Now $sint is a good candidate for this astrological trading technique however not all […]